The final report for the West Africa Mapping Hub is available for download here (6 MB)
2016 was a busy year for the the American Red Cross and the Missing Maps project. Community-led mapping projects took place in Colombia, Ecuador, and Zimbabwe. Our largest undertaking since the start of the Missing Maps project was in West Africa. Covering an area the size of Switzerland, volunteers in Liberia, Guinea, and Sierra Leone visited over 7,000 communities in an area that experienced the worst of the Ebola crisis in 2014 and 2015. Here’s a snapshot of what the volunteers accomplished:
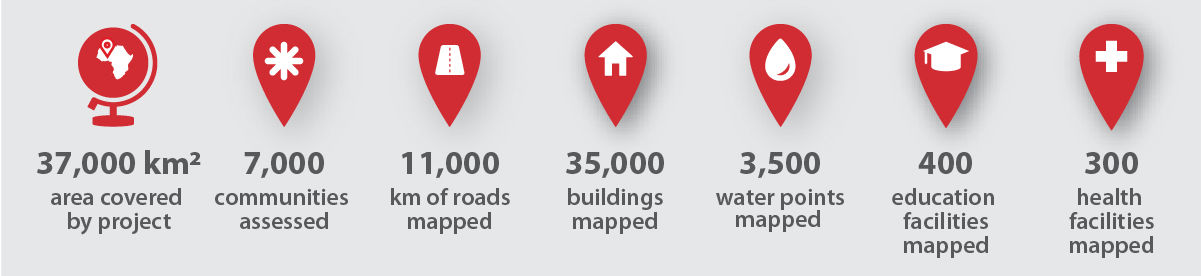
A few West Africa stats at a glance. CC-BY American Red Cross.
First and foremost, this project could not have been possible without the dedication of the Red Cross volunteers in Liberia, Guinea, and Sierra Leone. Over 120 volunteers plus an additional 109 motorbike drivers traveled 72,000 km visiting some of the most vulnerable communities in West Africa.
We started the West Africa project because information gaps in available data made it more difficult to combat Ebola. Accurate maps play a critical role in understanding human communities, especially for populations at risk. The lack of detailed maps for West Africa posed a problem during the 2014 Ebola crisis; contact tracing was much more difficult without accurate names and locations for all of the villages, particularly in the border areas.
The mapping project involved five processes, which consisted of tech development, a mapping hub, a rapid assessment survey, detailed community mapping, and community engagement.
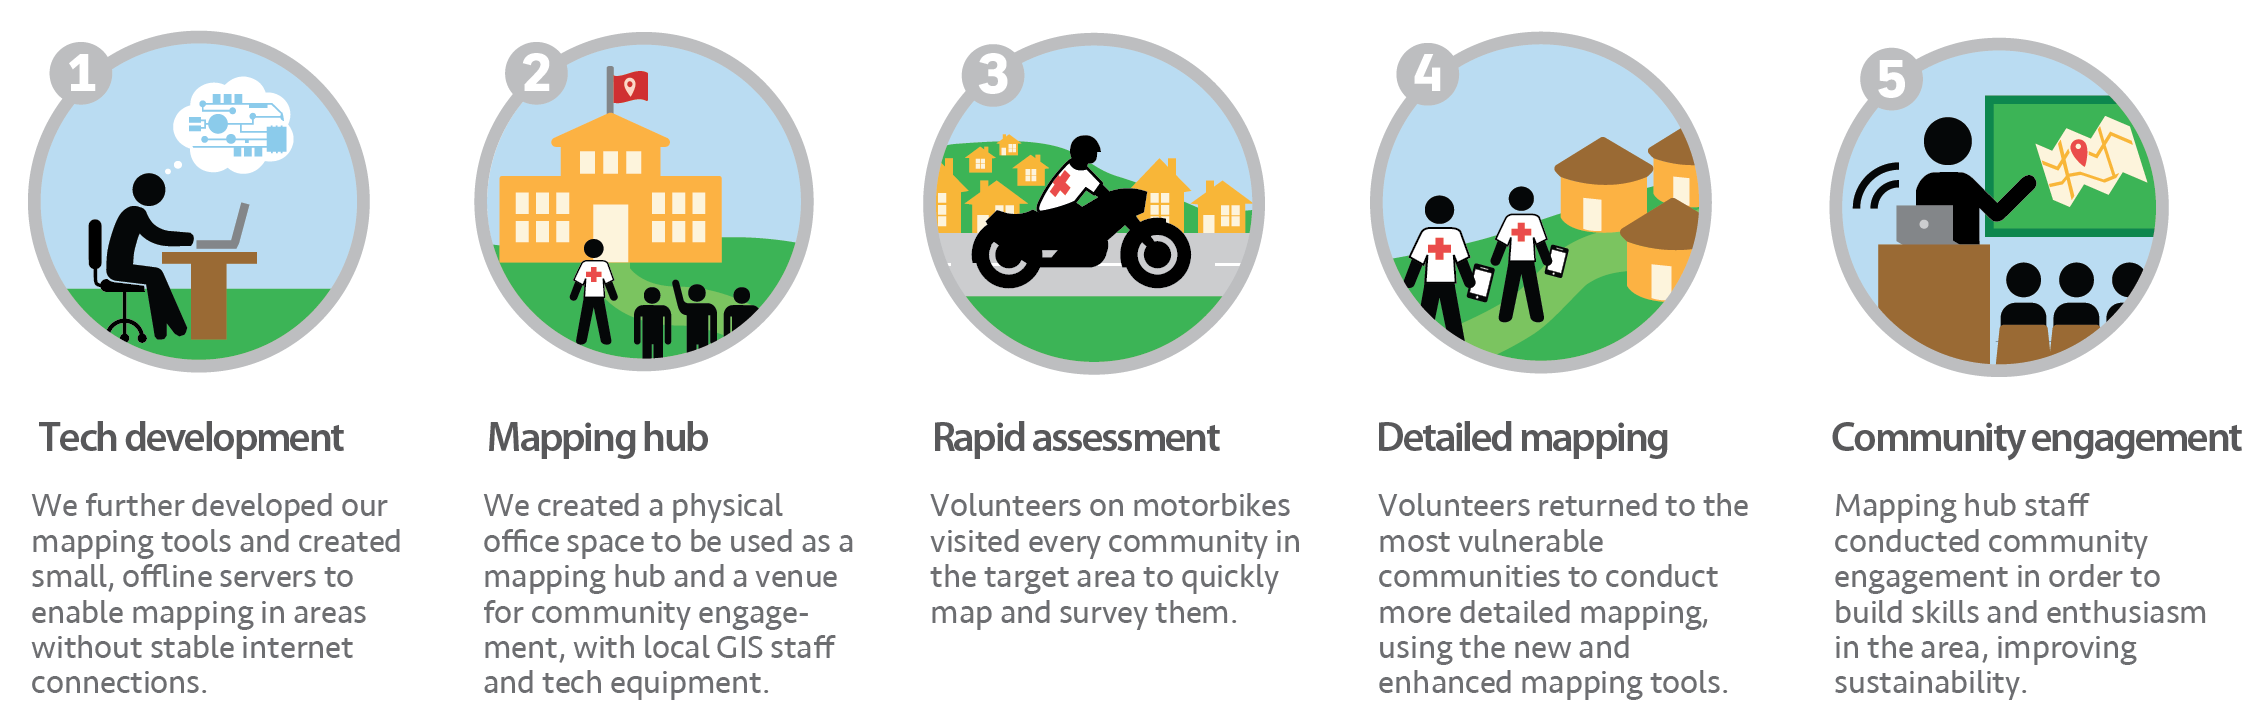
Project Phases. CC-BY American Red Cross.
Before the field work, we estimated that there were about 5,000 communities in the target area (based off of OpenStreetMap data). When we actually got on the ground, however, our volunteers visited 7,000 communities. Planning and logistics were a real challenge for this project - here’s what 7,000 communities look like across the area:
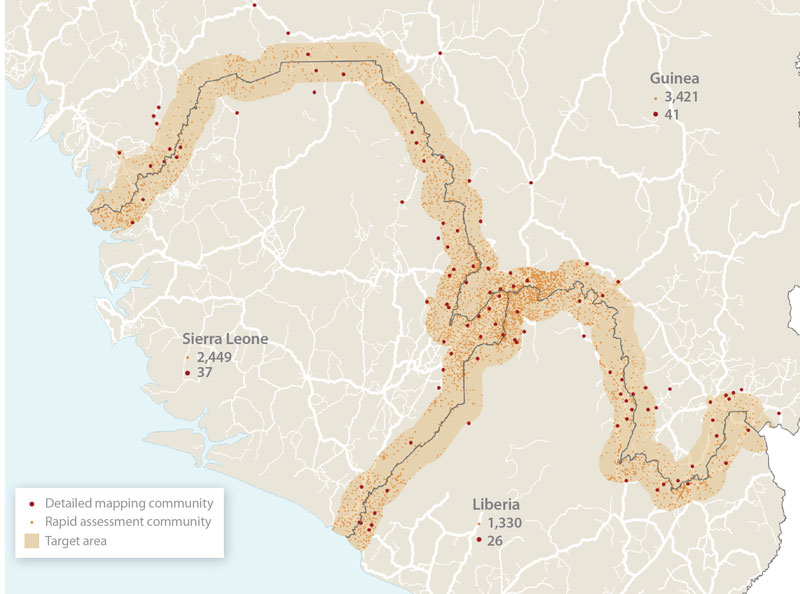
Project area and communities visited for rapid assessment and detailed mapping. CC-BY American Red Cross.
Tech Development
Our standard mapping tools consist of Android phones, OpenDataKit and OpenMapKit apps, and Field Papers. These apps are cloud-based and most of the enormous project area lacked connectivity (data signals and wifi). We know this would be a real challenge; without a signal, volunteers can’t upload surveys and staff can’t monitor progress or do troubleshooting. To address this issue, we developed Portable OpenStreetMap or POSM, a portable offline server. POSM enables us to do our full workflow offline and gave field team leaders a way to gather and push data in areas where there is no connectivity.
Here’s how POSM works:
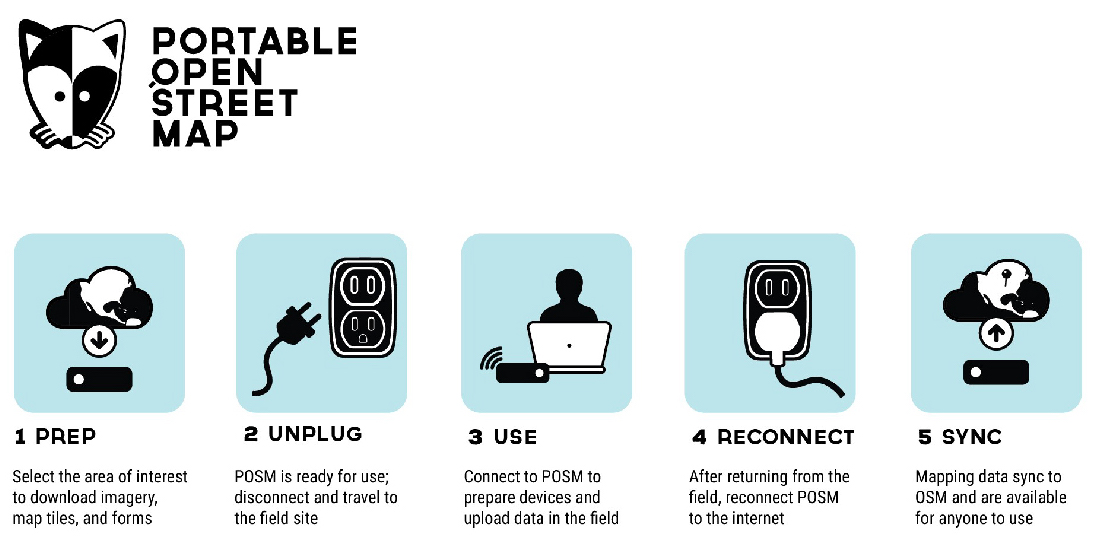
POSM workflow. CC-BY American Red Cross.
All of our code is available on GitHub, so please contribute as we continue to improve our mapping tools! https://github.com/AmericanRedCross/posm
Mapping Hub and Community Engagement
A mapping hub was established in Guéckédou, Guinea, which served as an operations base and a community engagement facility. Local GIS staff used the mapping hub as a central location to clean incoming data and interact with the local community, building capacity in both the use of OpenStreetMap and general computer, technical, and language skills. POSM also allowed the staff and volunteers to trace features into OpenStreetMap in an offline environment. This process is highlighted here. Through partners in each country, local OSM groups formed to continue mapping communities both inside and outside of the initial project area:
Rapid Assessment and Detailed Community Mapping
After initial training in ODK Collect and OpenMapKit use, the project began with a rapid assessment survey where volunteers visited every community within a distance of 15km of the Liberia, Guinea, and Sierra Leone borders. The survey consisted of questions related to access to health facilities, access to markets, access to clean drinking water, as well as inquired about the community’s experience to natural disasters in recent years. These questions were used to create a vulnerability index for all 7,000 communities in the project area.
Using the vulnerability index and major population centers, 104 communities were selected for detailed mapping; 26 in Liberia, 41 in Guinea, and 37 in Sierra Leone. Volunteers traced buildings and roads into OpenStreetMap and returned to these communities to map water points, schools, and and general points of interest. Using OpenMapKit, 300 health facilities, 400 education facilities, 3,500 water points, and over 12,000 points of interest were all added to OpenStreetMap. Data that was collected was reviewed for accuracy (workflow can be found on GitHub and uploaded to OpenStreetMap.
Based on the data collected and the communities visited, roughly 800 fixme location and name categories were removed from the project area in OpenStreetMap. Many of what appeared to be communities were actually seasonal farms or long abandoned villages. Many of the fixme categories marked communities that were based on out-of-date maps and government data that was over 50 years old.
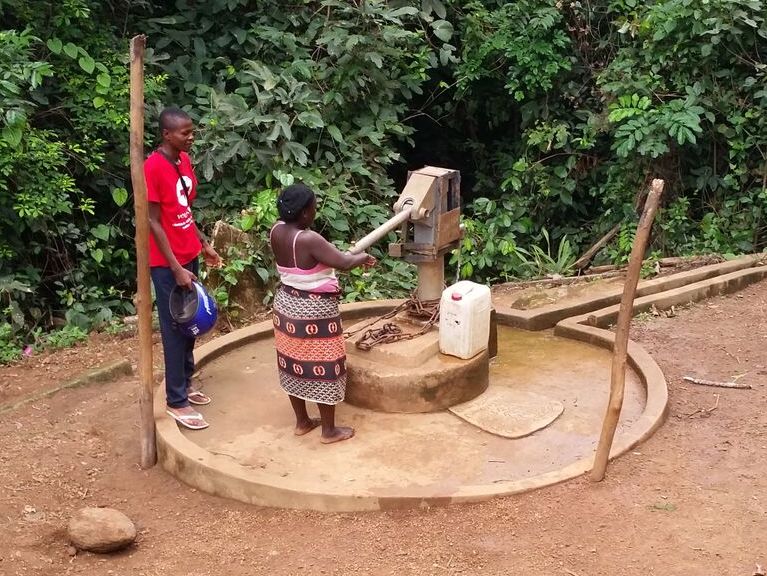
Volunteer mapping a water pump during the detailed mapping phase. CC-BY American Red Cross.
Want to learn more?
All of the data we collected is available for use on the Humanitarian Data Exchange and on OpenStreetMap.
For more background on the West Africa Project check out some of our earlier blog posts:
- Field Mapping at Scale in West Africa
- Without Frontiers in Border Country - A post by Rupert Allan with Missing Maps partner MSF, who helped train volunteers in Sierra Leone
- Reflections from our Mapping Hub Lead David Luswata Trends of Transformation by Mapping in West Africa and Mapping Every Detail
Check out some of the analysis already done with the data we collected: Mapping OpenSignal Data and Visualizing GPX tracks
We’ve also posted pictures from motorbikes and vehicles used in the project to Mapillary, so take a look through the 100 GB of photos that we uploaded!
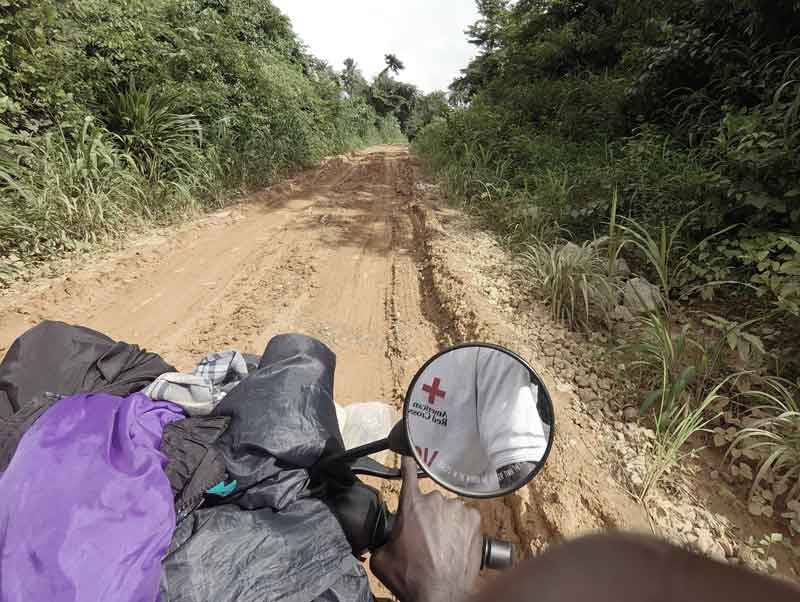
A Mapillary image captured from a volunteer on motorbike. CC-BY American Red Cross.
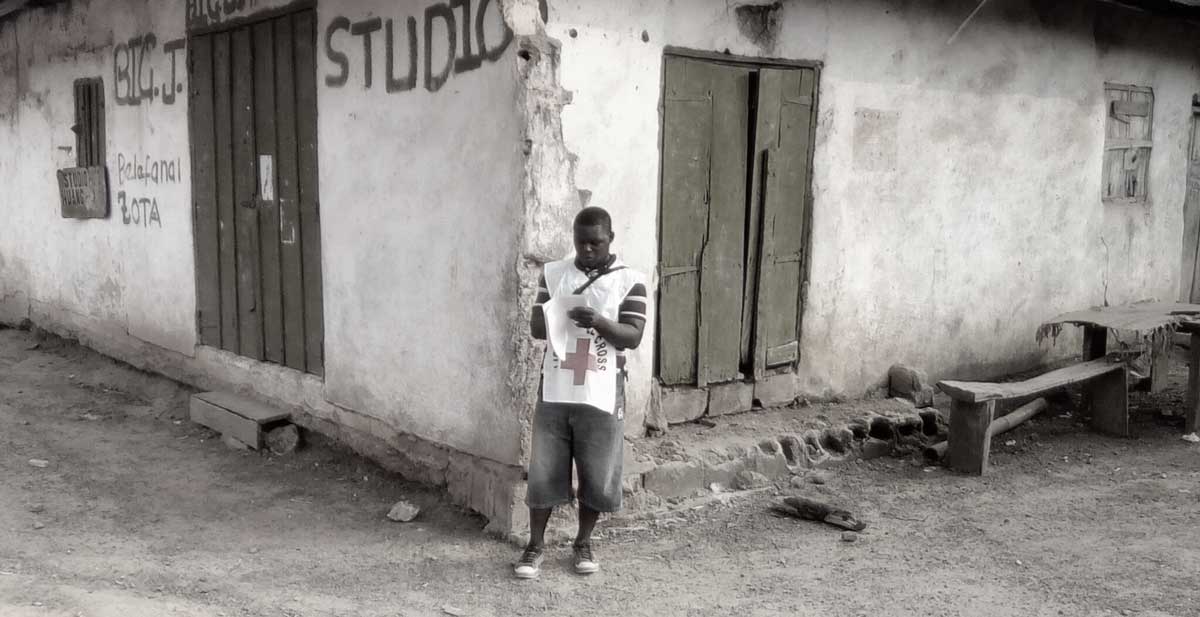
Again, this project could not have been completed without the tireless efforts of the 126 Red Cross volunteers who, equipped with a phone and a humanitarian spirit, helped put people on the map. THANKS to everyone who contributed to the project!
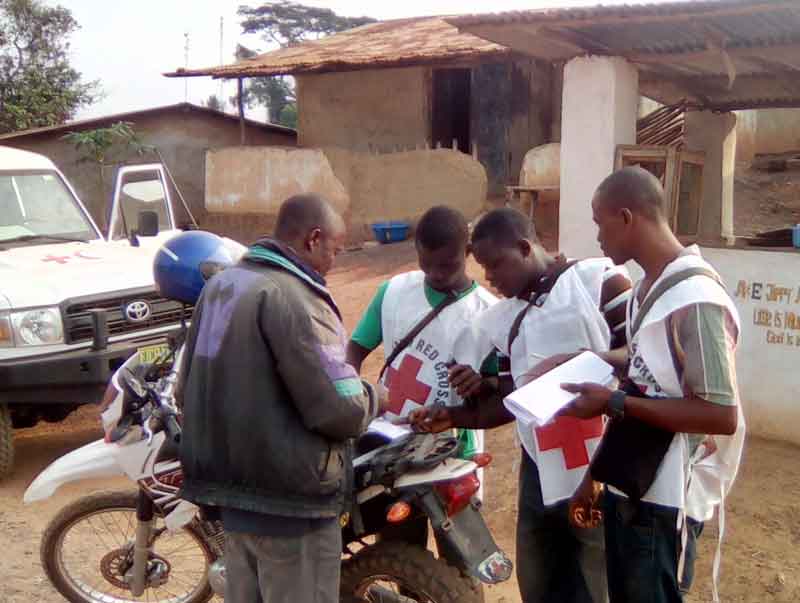
Field team leader discussing plans with volunteers in Liberia. CC-BY American Red Cross.