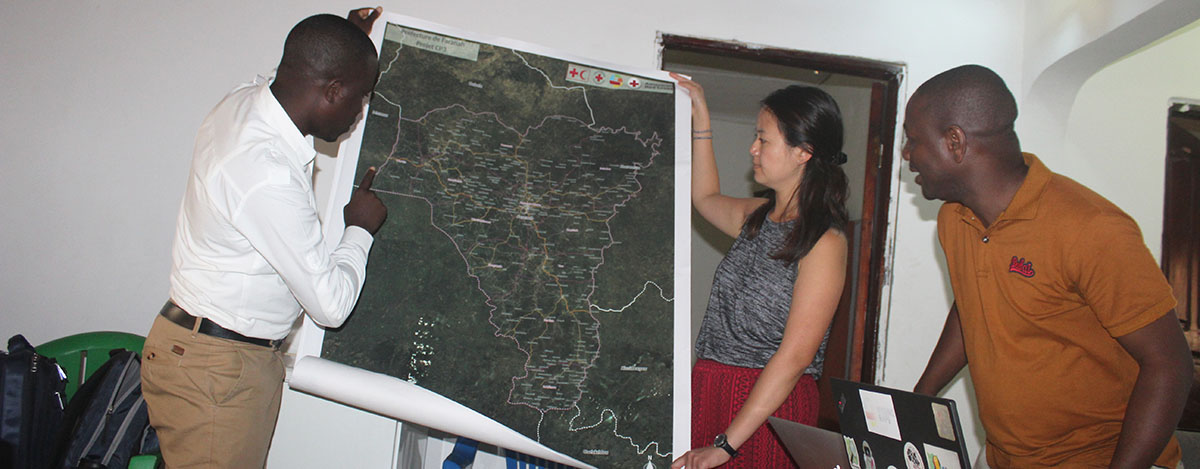
[Image 1: Two participants gathering building information during field data collection]
The ultimate goal of the Community Epidemic and Pandemic Preparedness Program (CP3), a program led by the International Federation of the Red Cross (IFRC), is to strengthen the ability of communities and civil society groups to prevent, detect, and respond to disease threats and play a central and significant role in assessing future risks.
Data Readiness is one priority and workstream within CP3. Through this workstream, we want national societies to be equipped to use quality and timely information to influence operations and planning; this is all with the goal of being able to respond effectively to disasters. CP3 relies on the methods and community engagement from the Missing Maps program to create base mapping data for many of the communities where CP3 is active.
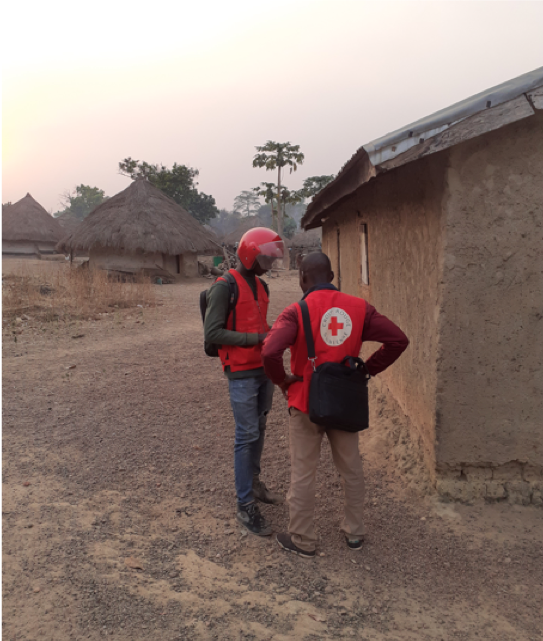
[Image 2: Map of Faranah by David Luswata]
OSM/Missing Maps for Faranah Prefecture, Guinea
Over the past several months, the CP3 team and the Guinean Red Cross Society (GRCS) mobilized around an intensive community mapping activity. This has been an multi-step process facilitated by key stakeholders including:
- IFRC
- GeoSynapse Guinée
- Youth Mappers
- Missing Maps
- American Red Cross
- Guinean Red Cross Society (GRCS)
The three phases of community mapping are outlined below followed by the takeaway points of the project:
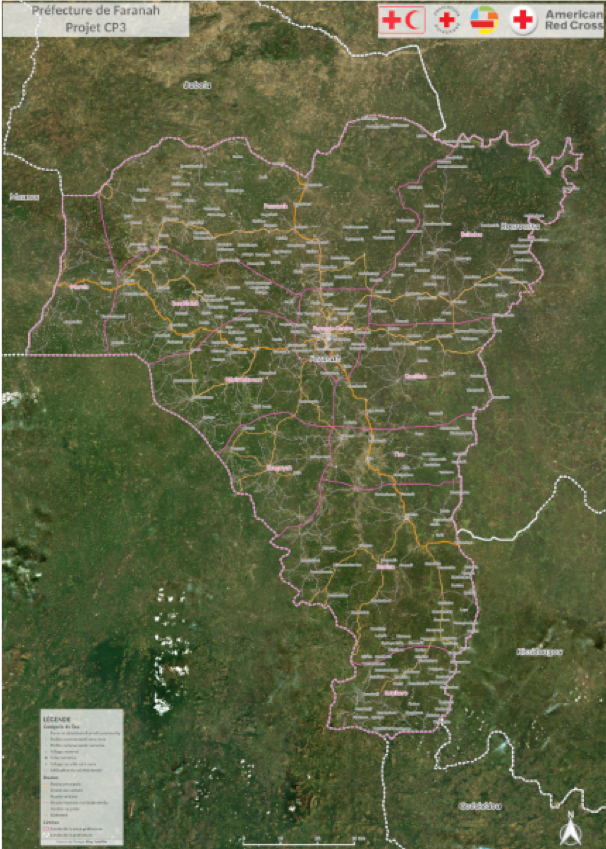
[Image 3: Guinean Red Cross Society members and volunteers from Geo-synapses gather for a mapathon in Conakry]
Phase 1: Remote mapping
Staff and volunteers from the various organizations (most notably from the GRCS and GeoSynapse Guinée) came together and took part in mapathons and worked remotely to populate buildings and roads in Faranah, Guinea.
| # | Sub Prefectures Remote Mapped | Buildings | Roads (Kms) |
|---|---|---|---|
| 1 | Banian | 14,133 | 1,661.16 |
| 2 | Beindou | 6,071 | 486.24 |
| 3 | Faranah centre | 17,868 | 1,222.31 |
| 4 | Ghaleah et Tindo | 8,558 | 478.02 |
| 5 | Heremakono | 9,730 | 826.54 |
| 6 | Kobokoro | 3,912 | 452.29 |
| 7 | Marella | 1,009 | 123.22 |
| 8 | Passayah | 4,809 | 872.76 |
| 9 | Sandeniah | 3,102 | 843.52 |
| 10 | Songoyah | 4,127 | 453.75 |
| 11 | Tiro | 6,445 | 391.15 |
| Total | 79,764.00 | 7,810.96 |
[Table 1 showing remote mapping statistics in Faranah prefecture courtesy of Tino Toupane]
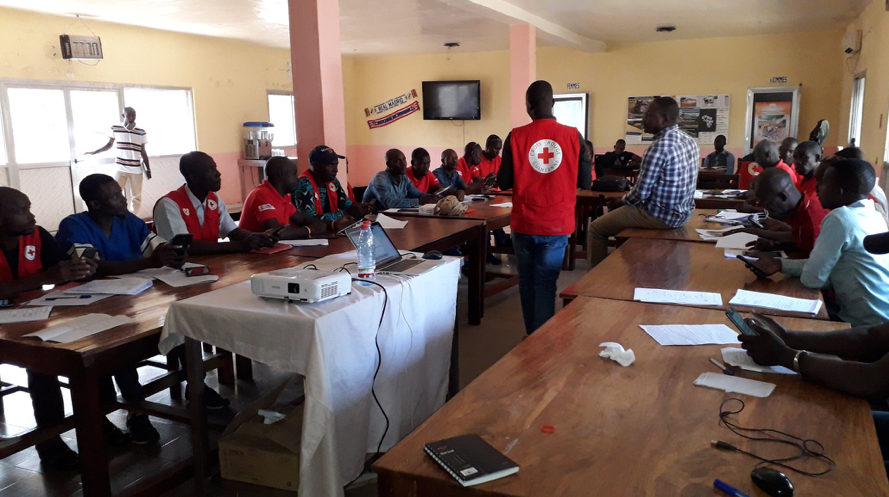
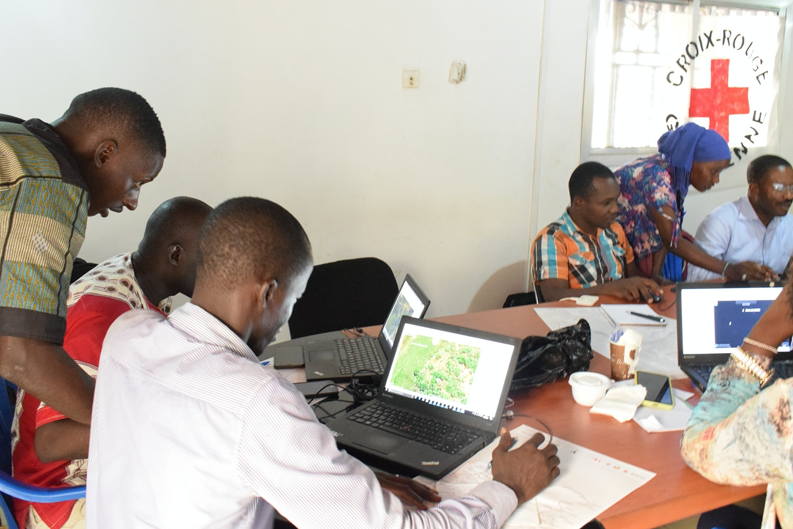
[Image 4: A picture of the participants taken from the 4-day field data collection training.]
Phase 2: Training and Field Data Collection
After the remote mapping activity was complete, the American Red Cross, IFRC, and CP3 teams led a four-day training for the field data collection participants. The goal of this training was to equip CP3 and GRCS team members with technical skills necessary for a comprehensive data collection through data management workshops and data collection demo sessions.
During the training, participants were introduced to the Data Model that was structured for the collected points of interest to be brought into OSM.
At the end of this field data collection activity, the following features were mapped across all of Faranah prefecture.
| Feature Mapped | Total feature count in Faranah | |
|---|---|---|
| 1 | Number of sub-prefectures mapped | 11 |
| 2 | Communities mapped | 399 |
| 3 | Health Facilities | 55 |
| 4 | Administrative and community infrastructure | 106 |
| 5 | Security services | 33 |
| 6 | Market Places | 56 |
| 7 | Points of Entry (Border Crossing) | 24 |
| 8 | Sub branches of Guinea Red Cross across the prefecture of Faranah | 6 |
| 9 | Education Facilities | 220 |
| 10 | Water Facilities | 491 |
| 11 | Places of Worship | 373 |
| 12 | Guest Houses | 7 |
| 13 | Cemeteries | 160 |
| 14 | Communication Towers | 28 |
| 15 | Community Radios | 4 |
| 16 | Social Facilities | 87 |
[Table 2 showing data collected during the community mapping activities in Faranah]
Phase 3: Community Validation of the Collected Dataset in the Sub-Prefectures
In the next phase of this work, there was a scheduled community validation session where GRCS and the CP3 team will sit down with the community to discuss the data collected and any gaps that may exist within them. Unfortunately, this last step has been delayed due to the COVID-19 pandemic crisis. After this validation process takes place, the data will be uploaded into OSM for public consumption and usage. While we wait to meet with the community for this group validation session, data from the project can be found here.
West Africa Mapping Project
This is not the first time a Missing Maps activity has taken place in Guinea. Missing Maps was involved with the West Africa Mapping Project that took place in 2016, after the Ebola crisis in the country. Here in this post are some valuable lessons learned from that previous community mapping work.
The Takeaway
With this productive collaboration between the major stakeholders, the Guinean Red Cross Society and the Guinea/CP3 staff and volunteers learned how to create their own data in OSM both remotely and via training/data collection. The processes that teams learned in remote mapping, training and field data collection, allowed them to have insight into how mapping data was produced, uploaded, and downloaded from OSM (and other open-data platforms like HDX).
We hope this post demonstrates our community mapping workflow with other technical teams interested in adding a data collection or map component to their program.
Very recently, the GRCS offices have been creating contingency plans to address the COVID-19 response in Guinea. The dataset compiled and uploaded during this community mapping work allowed the headquarters teams to have a more up-to-date list of border crossing points (including international travel areas) and health facilities for Faranah, information which are vital to the current emergency planning and response efforts.
[A map of GRCS offices across Guinea]
Guinea Red Cross, with all her 38 branches, continues to serve humanity in the territorial boundaries of the Republic of Guinea, and we are all very glad to support these efforts.